
The latest NPLA Private Lending Market Report is now available, delivering new data on private lending activity across the United States. Published in partnership with SFR Analytics and Private Lender Law, the report tracks RTL and DSCR lending trends, pricing, and market activity to help lenders, brokers, and industry professionals make more informed business decisions.
This month’s report provides updated insights into private lender penetration by market, including RTL and DSCR interest rate trends, points and pricing analysis, market concentration, year-over-year private lender share gains, and the top and lowest private lender penetration markets across the U.S. It also highlights where lenders may find new growth opportunities as private lending continues to expand.
June data shows interest rates held relatively stable across both major business-purpose lending products. Median rates came in at 9.99% for RTL loans and 6.88% for DSCR loans, while pricing competition remained concentrated: 76% of RTL loans fell between 9% and 12%, and 90% of DSCR loans fell between 6% and 8%.
The report also examines how lenders continue to differentiate themselves through loan pricing. Median points in June were 0.98 for RTL loans and 1.00 for DSCR loans, with lenders using a wide range of strategies to balance note rates against upfront economics. The report’s rate-versus-points analysis illustrates how this balance plays out across loan types.
One of the report’s key findings is the continued growth of private lending nationwide. From July 1, 2025 through June 30, 2026, private lenders financed 16.4% of all investor single-family home purchases, an increase of 1.8 percentage points year over year. Among the country’s 25 largest investor markets, 21 saw private lenders grow their share of financed purchases.
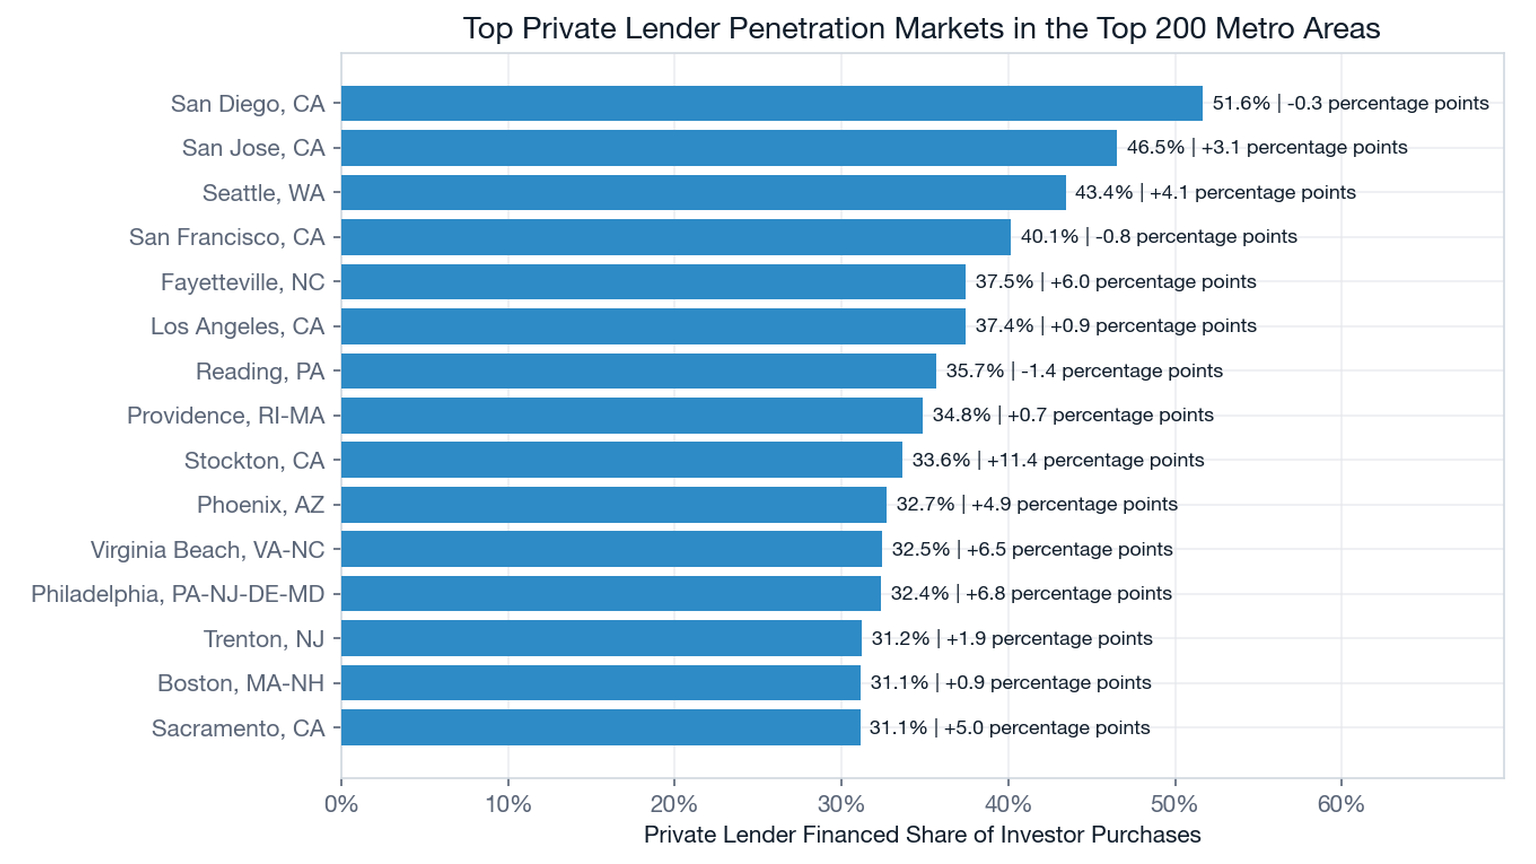
San Diego led all top 200 metro areas, with private lenders financing 51.6% of investor purchases. Among the 25 largest investor markets, Los Angeles topped the list at 37.4% penetration. Many of the highest-penetration markets also carry higher average home prices — four of the top five rank in the top decile nationally — reflecting fewer all-cash investor purchases and greater reliance on financing.
While competition remains strong in established markets, the report points to growing opportunities in tertiary markets, where private lenders often finance less than 20% of investor acquisitions. That gap leaves room for lenders to capture borrowers who have traditionally relied on regional banks or cash purchases.
At the other end of the spectrum, the report’s lowest-penetration markets show that low private lender share doesn’t mean low investor activity. Across the 10 lowest-penetration metro areas, investors acquired more than 7,100 single-family homes over the past year — but private lenders financed only 71 of those purchases, roughly 1%. In these markets, the opportunity lies less in generating investor demand and more in displacing cash purchases, regional banks, and conventional lenders.
As private lending continues to evolve, timely, accurate market data is essential. The June 2026 NPLA Private Lending Market Report provides the pricing trends, market share figures, and geographic insight industry professionals need to make better-informed lending and business decisions.
Thank you to our partners at SFR Analytics and Private Lender Law for supporting this market intelligence and helping bring greater transparency to private lending data.