RTL Loans & DSCR Loans—Volume, Rates, Points, and Geographic Analysis
The Private Lending Market Report provides insight into bridge and DSCR loan activity across the country, including volume, rates, points, and market trends. Built for lenders, brokers, and industry professionals, it offers practical intelligence on pricing, competition, and where private lending activity is growing.
This report is brought to you monthly by the National Private Lenders Association, in partnership with Private Lender Law, the premier nationwide law firm representing private lenders, and SFR Analytics, a leading provider of data, analytics, and market intelligence for real estate investors and lenders.
This monthly report provides you with general market information and observed trends across Bridge and DSCR loan activity. The report is intended to support awareness of current market conditions and industry developments. The information included is descriptive, not prescriptive. NPLA does not recommend any particular pricing, loan terms, underwriting standards, credit criteria, or business practices. Each reader remains solely responsible for making its own independent business, pricing, underwriting, credit, compliance, and legal decisions.
This month’s report includes industry perspective from Eric Abramovich, offering added context on key trends, activity levels, and market observations from April.
Eric Abramovich, Roc Capital, NPLA Advisory Council Chairman
“The April NPLA Private Lending Report reflects the continued resilience and maturation of the private lending market. Despite ongoing geopolitical uncertainty, pricing for both bridge and DSCR loans has remained stable — and in some cases improved — underscoring the depth of institutional demand for residential credit exposure. NONQM securitization issuance continues to outpace last year’s record-setting volumes, while demand for RTL securitizations remains exceptionally strong. The limiting factor today is not investor appetite, but the industry’s ability to originate enough high-quality RTL product to meet that demand. This continued liquidity is a powerful signal that private lending has firmly established itself as a durable and institutionalized asset class.”
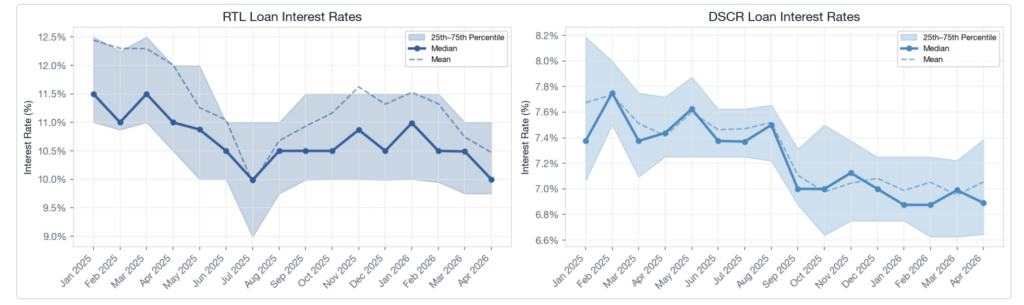
RTL rates remain in the same approximate range of 9.5–11%. DSCR rates remain steady as well, with a median of 7% that has held through 2026.
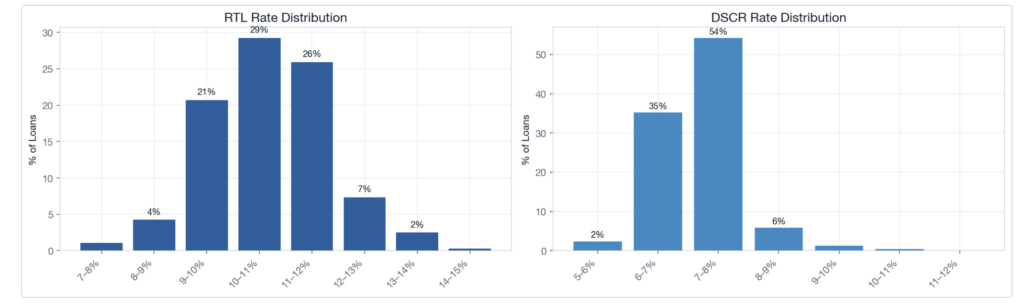
RTL rates have a larger dispersion while DSCR rates are concentrated between 6–8%, with 90% of DSCR loans falling in that 2-point range.
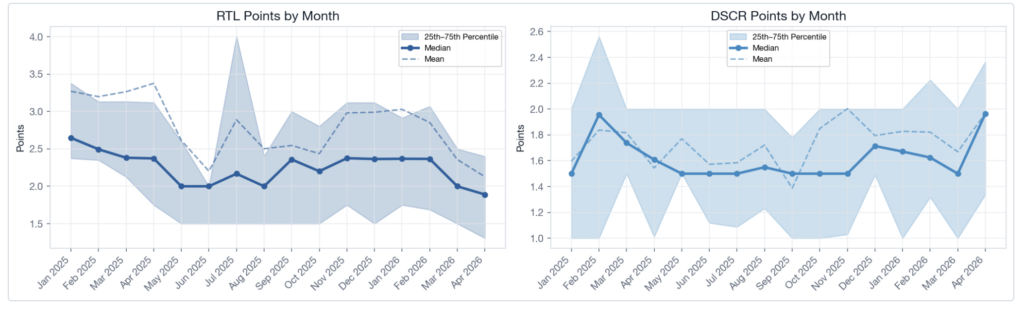
RTL saw a modest decrease in points, while DSCR saw a larger increase of ~0.4%. Both fall within near-term ranges.
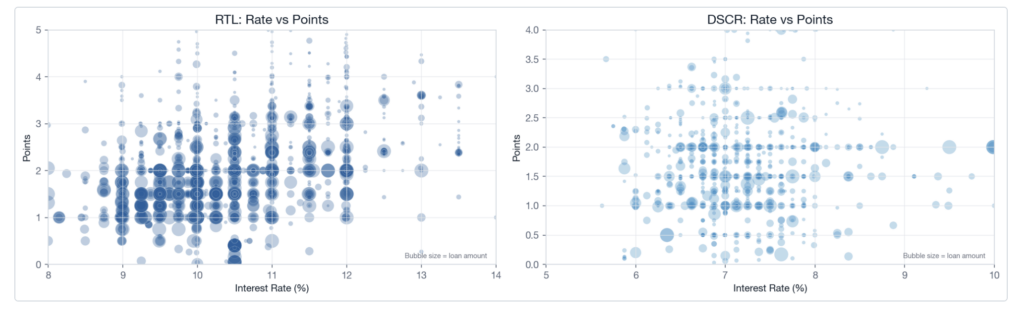
The scatter makes the structural difference between the two products plain. RTL deals form a visible cluster around 10-11% and 1-2 points, but the spread is wide — some lenders offer lower rates with higher points, others go the reverse, and a long tail of small short-duration loans sits at 12%+ with 3-5 points. DSCR deals cluster tightly around 7-8% and 0.5-2 points with very little dispersion.
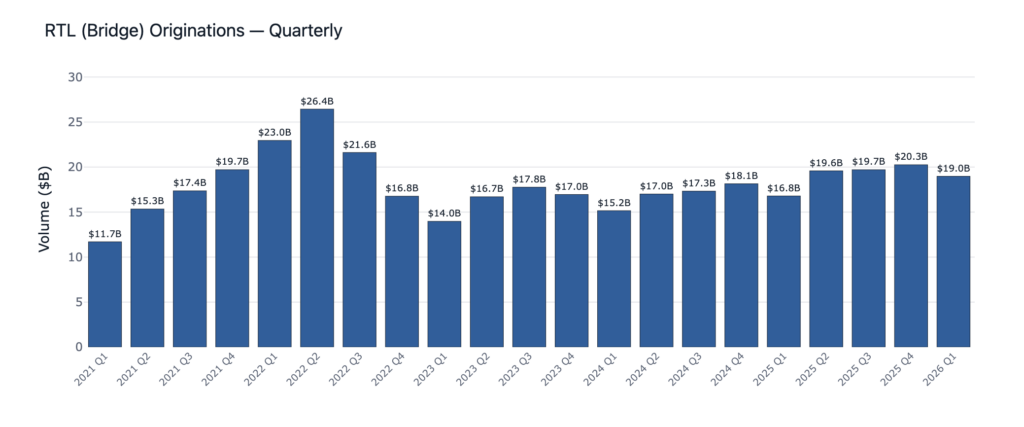
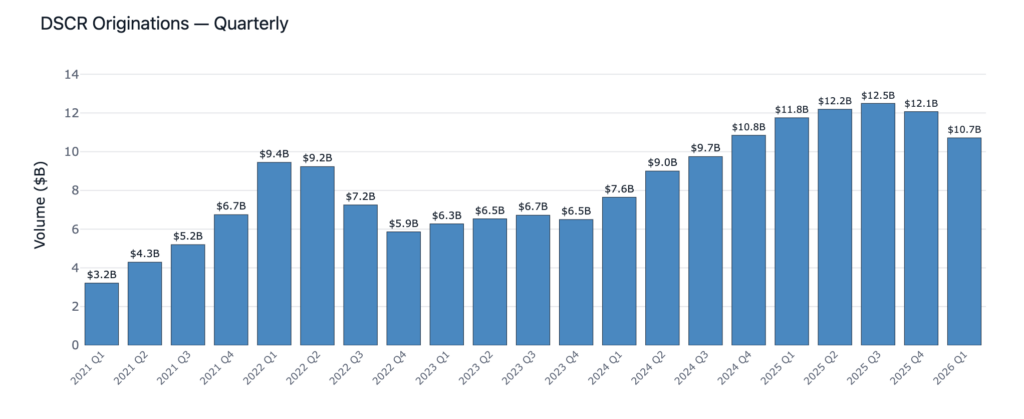
Stepping back from deal-level pricing, the broader market posted its strongest Q1 on record. Private ender originations totaled $29.7B, up +4.0% YoY year over year. The headline number masks a sharp divergence underneath: RTL surged +13.0% YoY while DSCR contracted -8.8% YoY. Capital is rotating into transitional and value-add deals as buy-and-hold investors stay on the sidelines waiting for cap rates to widen.
DSCR came in at $10.7B, off -8.8% YoY from the Q1 2025 high-water mark. Q1 2026 still tracks well above the 2023-2024 trough and is pacing for another year of near $50B in DSCR origination volume.
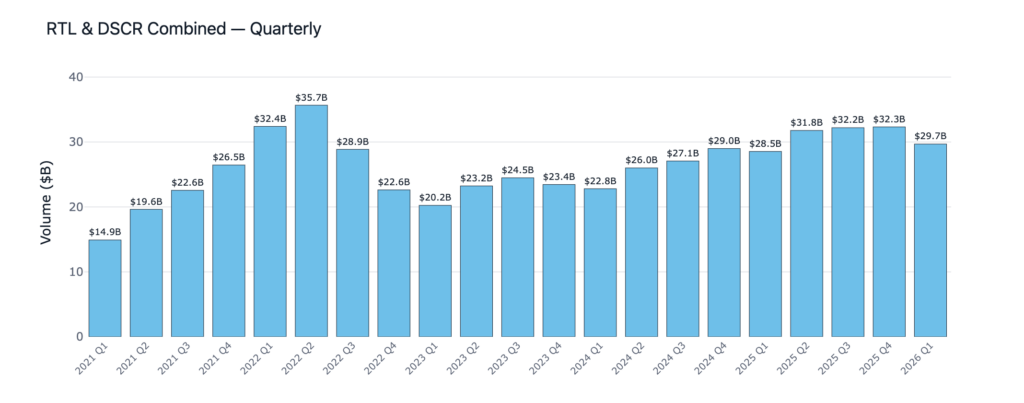
Q1 2026 is the strongest Q1 for private lending activity yet. Combined DSCR & RTL activity was just under $30B, up ~4.2% YoY.
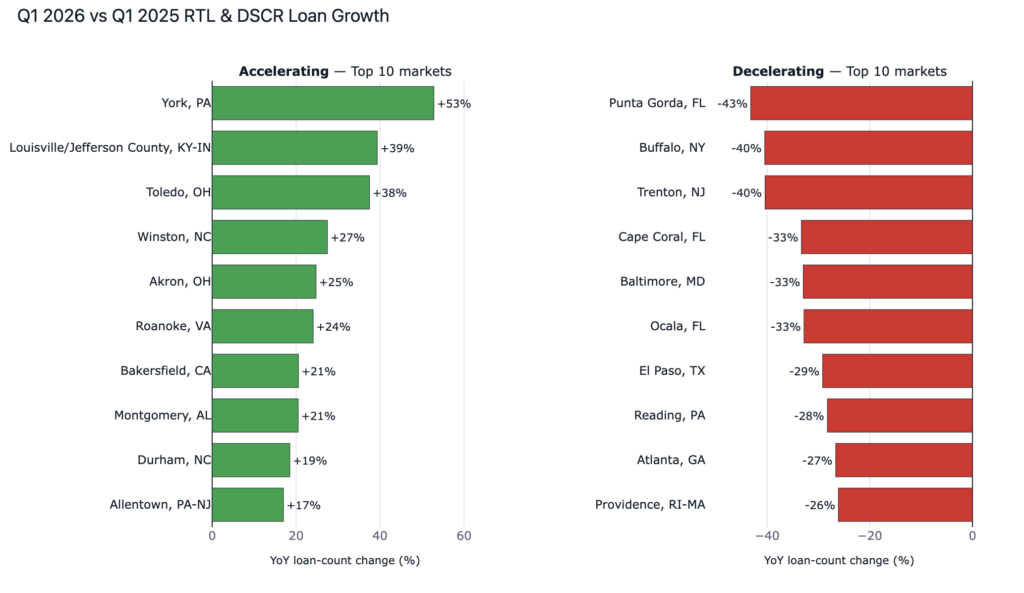
The Midwest and North Carolina had the markets that grew the most YoY in Q1 for private lending activity, while 3 of the 10 markets that showed the largest decreases in YoY activity were in Florida.
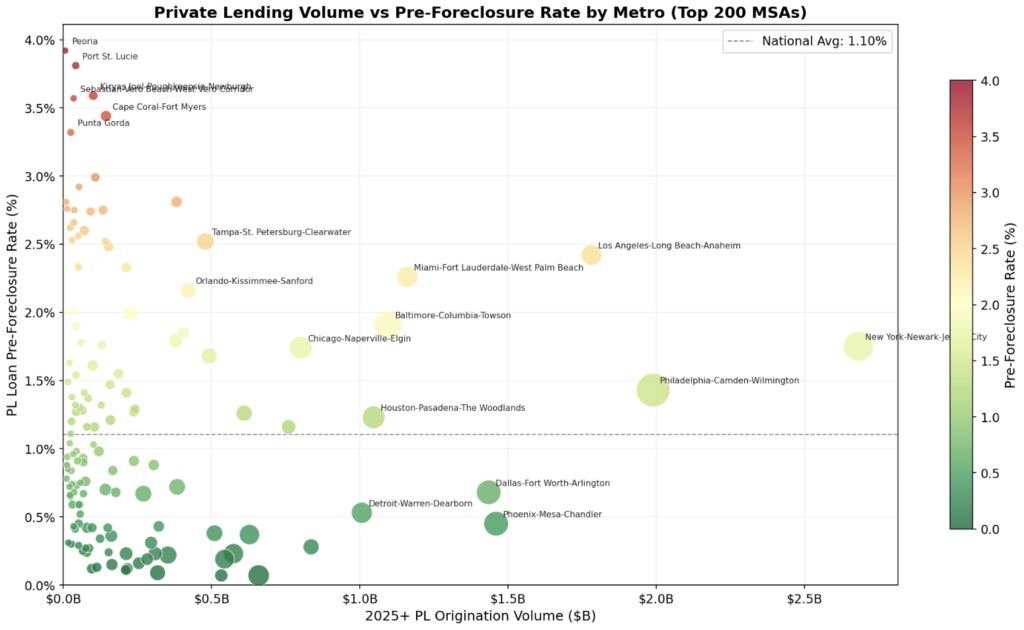
Nationwide, 1.10% of outstanding loans originated by private lenders are actively in pre-foreclosure. Florida is leading the charge, with 7 of the top 10 markets with the highest rate of pre-foreclosure activity.
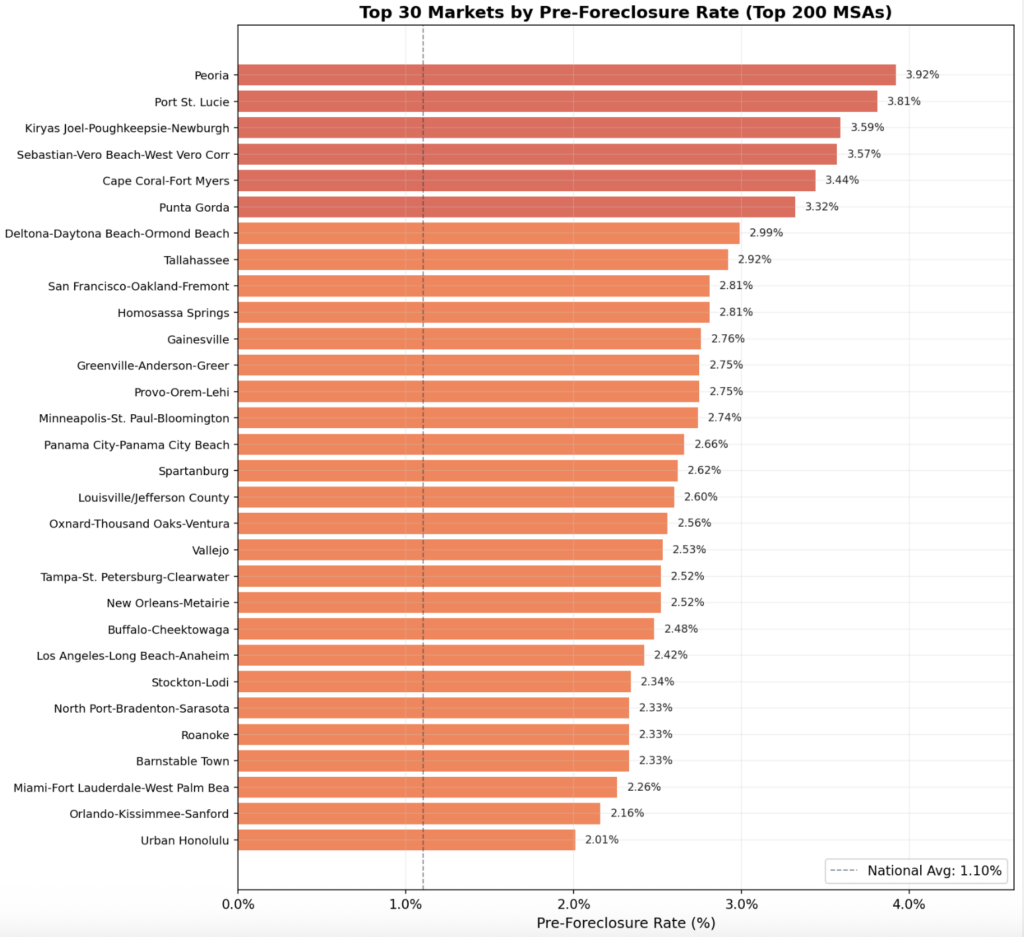
Many of the largest private lending markets are strong with relatively light pre-foreclosure activity. Every major market has a <2.5% pre-foreclosure rate, and markets with higher rates tend to be geographically concentrated.