Market Report
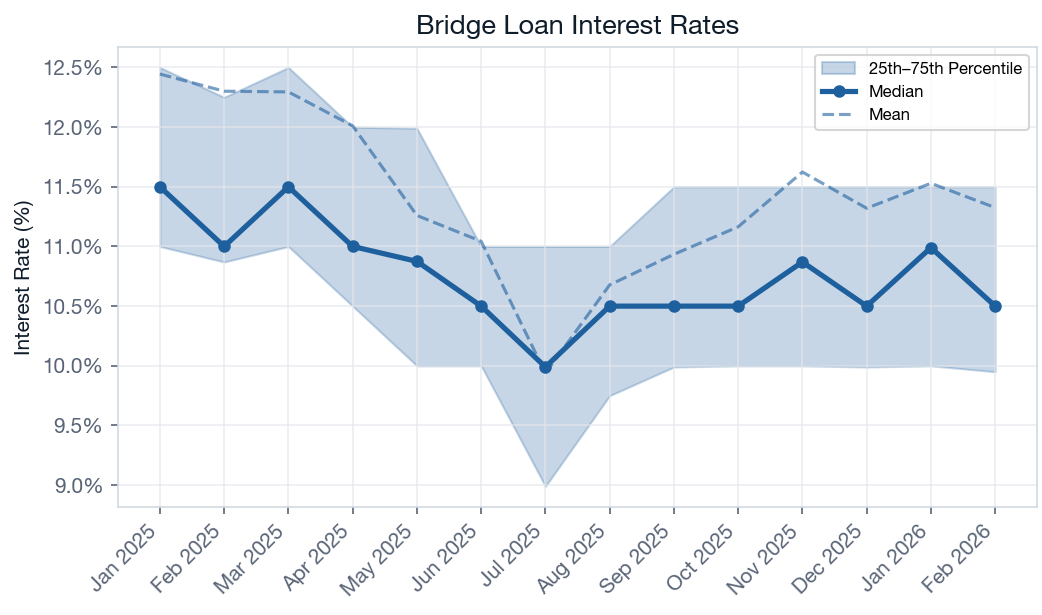
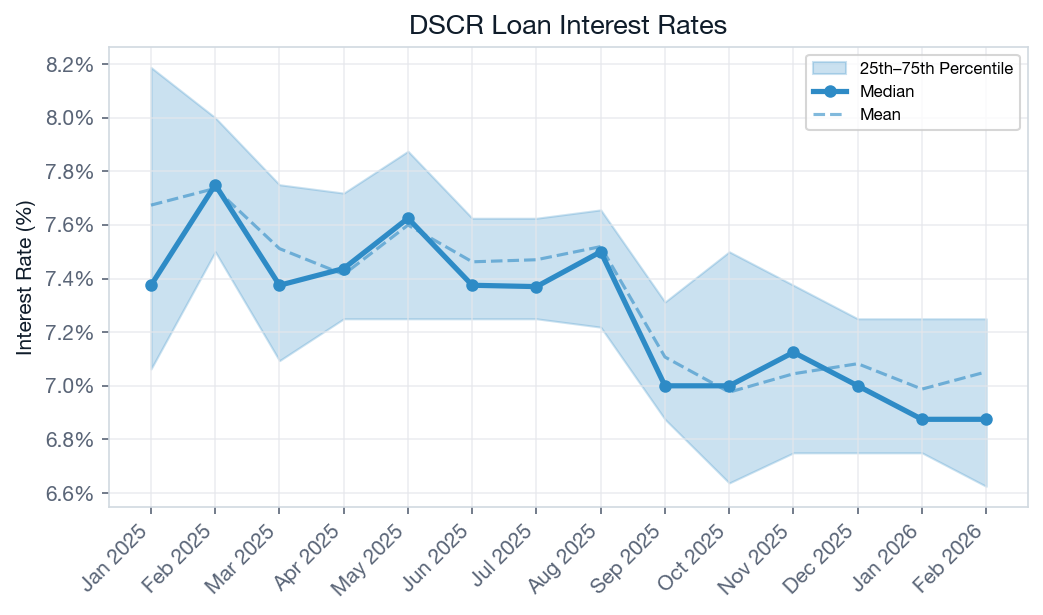
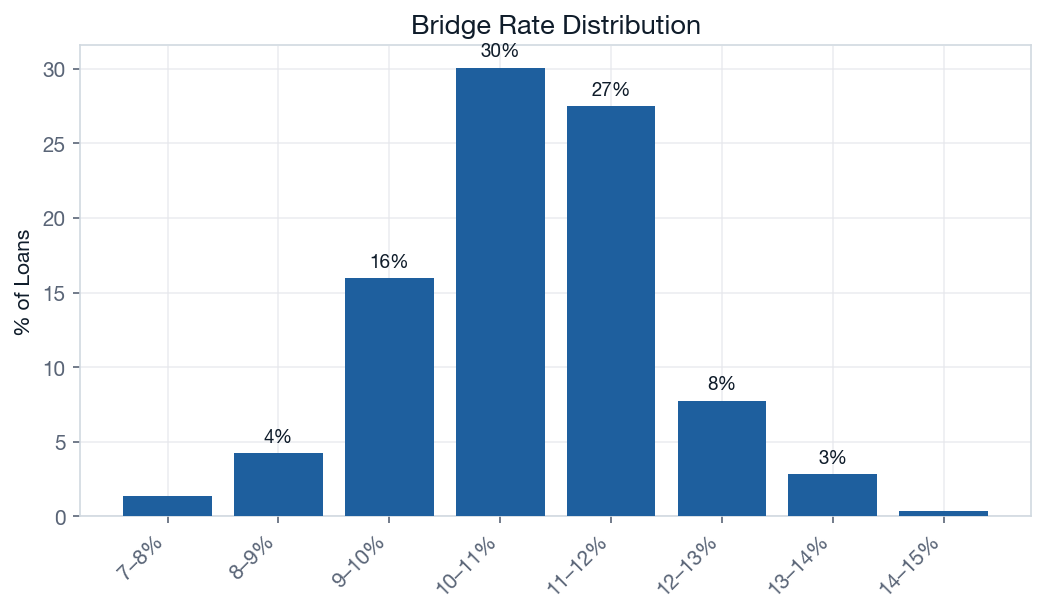
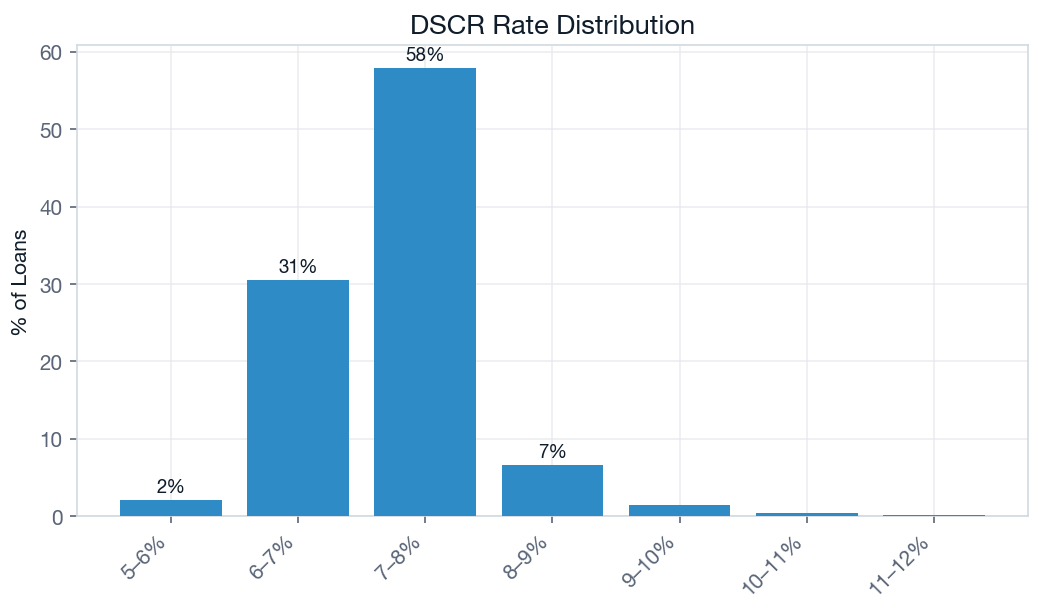
NPLA Private Lending Market Report: Bridge & DSCR Loan Trends
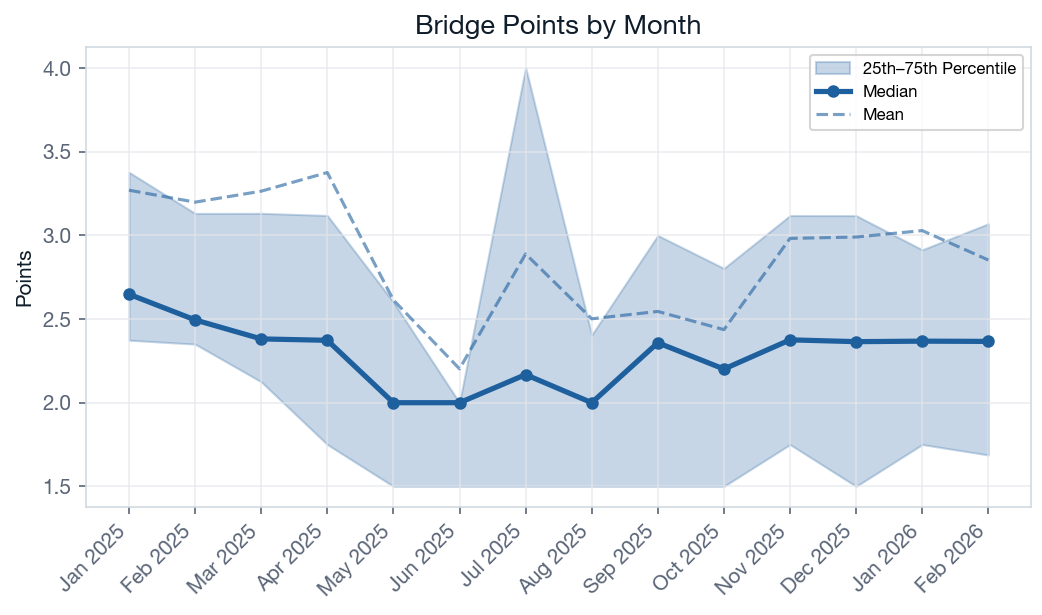
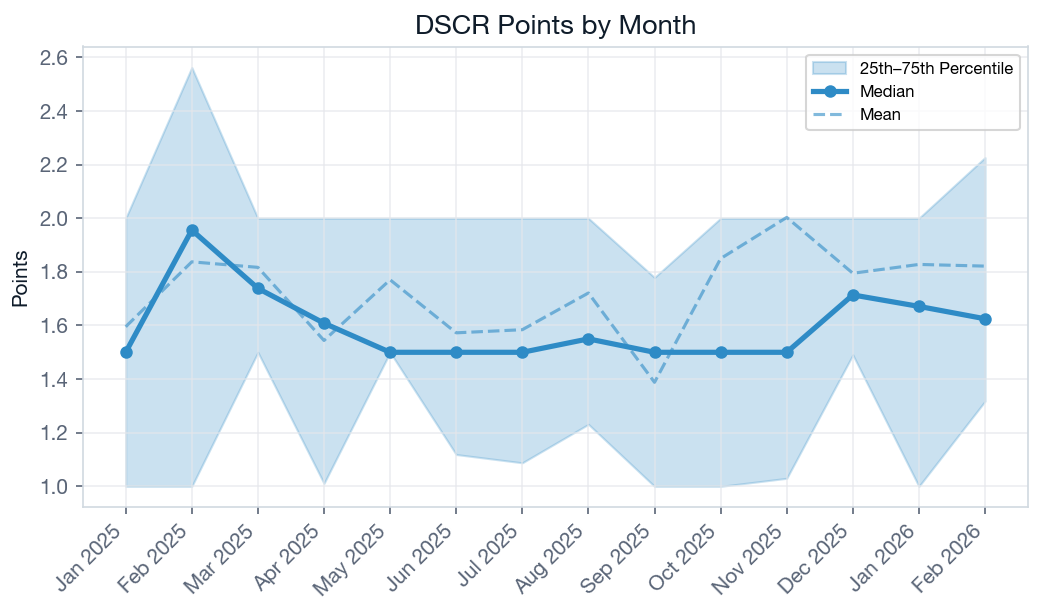
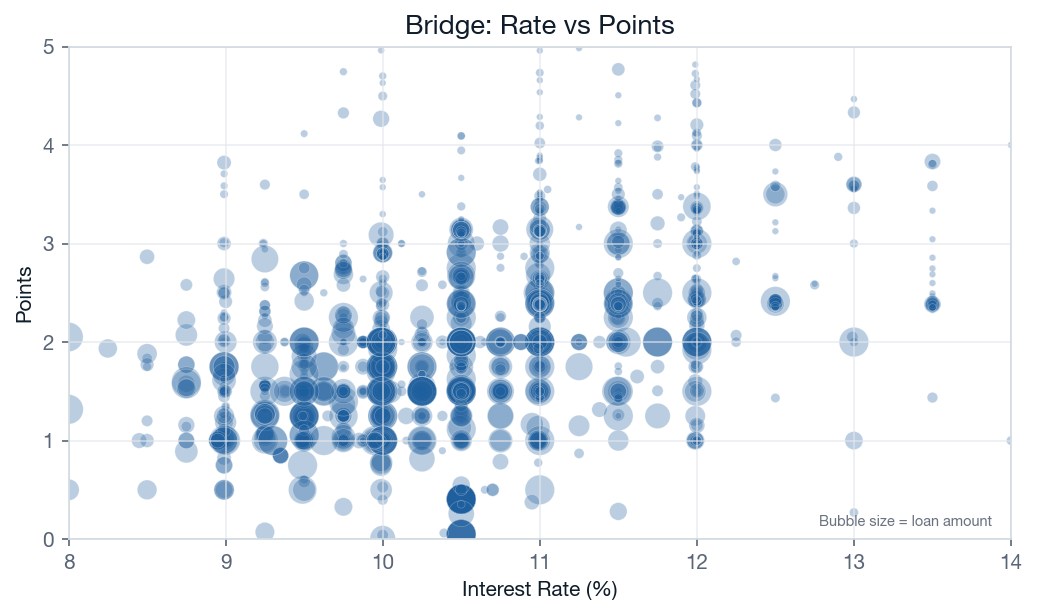
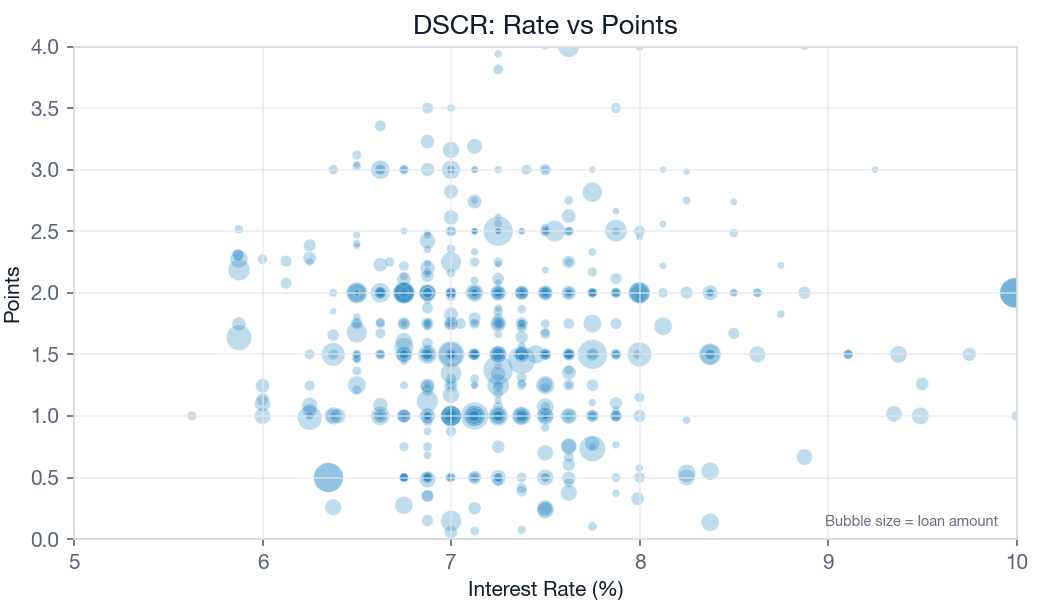
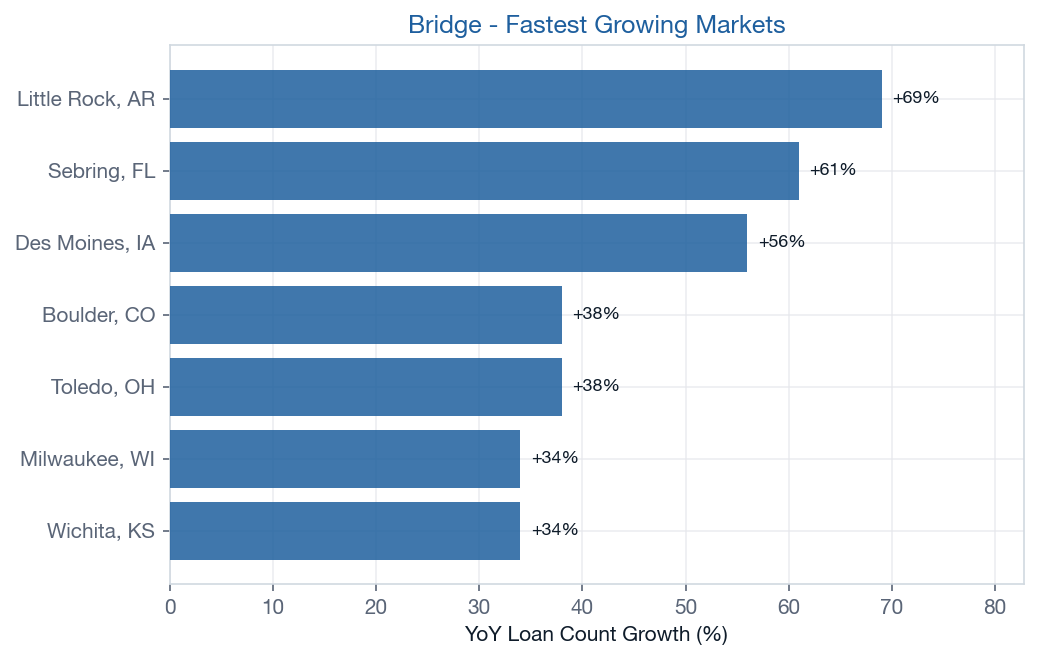
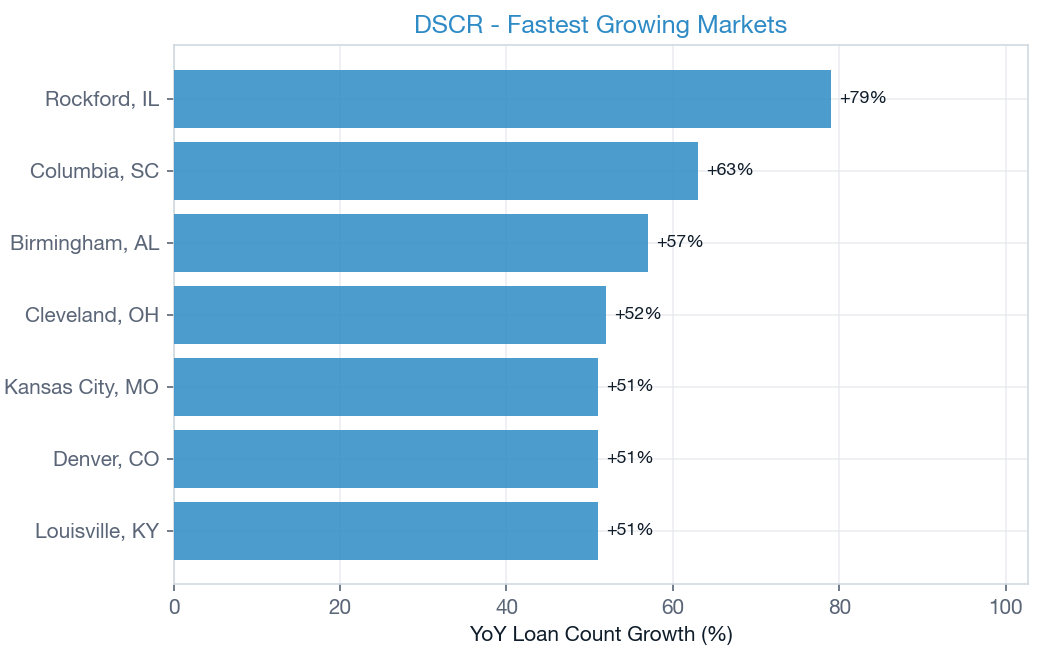
The Private Lending Market Report provides insight into bridge and DSCR loan activity across the country, including volume, rates, points, and market trends.
Built for lenders, brokers, and industry professionals, it offers practical intelligence on pricing, competition, and where private lending activity is growing.